Remote debugging of Node.js apps on Azure App Service from WebStorm
Edit on GitHubAt Microsoft Build 2018, a number of Azure App Service on Linux enhancements were announced. One that I was interested in was this one:
Remote debugging, in public preview: You can now choose to remote debug your Node.JS applications running on App Service on Linux.
Sweet! But… how? The blog post did not mention a lot of details on the debugging part, so let’s walk through it, shall we? Remote debugging of Node.js apps on Azure App Service from WebStorm!
Prerequisites
First of all, we will need a number of things on our machine:
- The latest version of the Azure CLI 2.0
The latest
webappCLI extension preview. To get it, open a command prompt, make sure theazcommand is on thePATH, and run:az extension add --name webapp(or
az extension update --name webappif already installed)
Other thing we will need, of course, are an active Azure subscription, as well as an App Service on Linux that we can play with.
1. Setting up the Azure side
On the Azure side, there is only one thing that has to happen: our Node.js application has to run with node’s --inspect flag.
And great news! As described in a post by Kenneth Auchenberg, things should “just work ™”!
Unfortunately, that did not work for me… At time of writing (see this post’s publish date), debugging Node.js on App Service on Linux is still in preview and my guess is not all regions have the required magic deployed.
The good thing is development of many Azure things happens in the open! A bit of searching revealed a pull request containing the required magic, and let me to discovering the one thing needed to get the Azure side of things set up: starting our app with the --inspect flag.
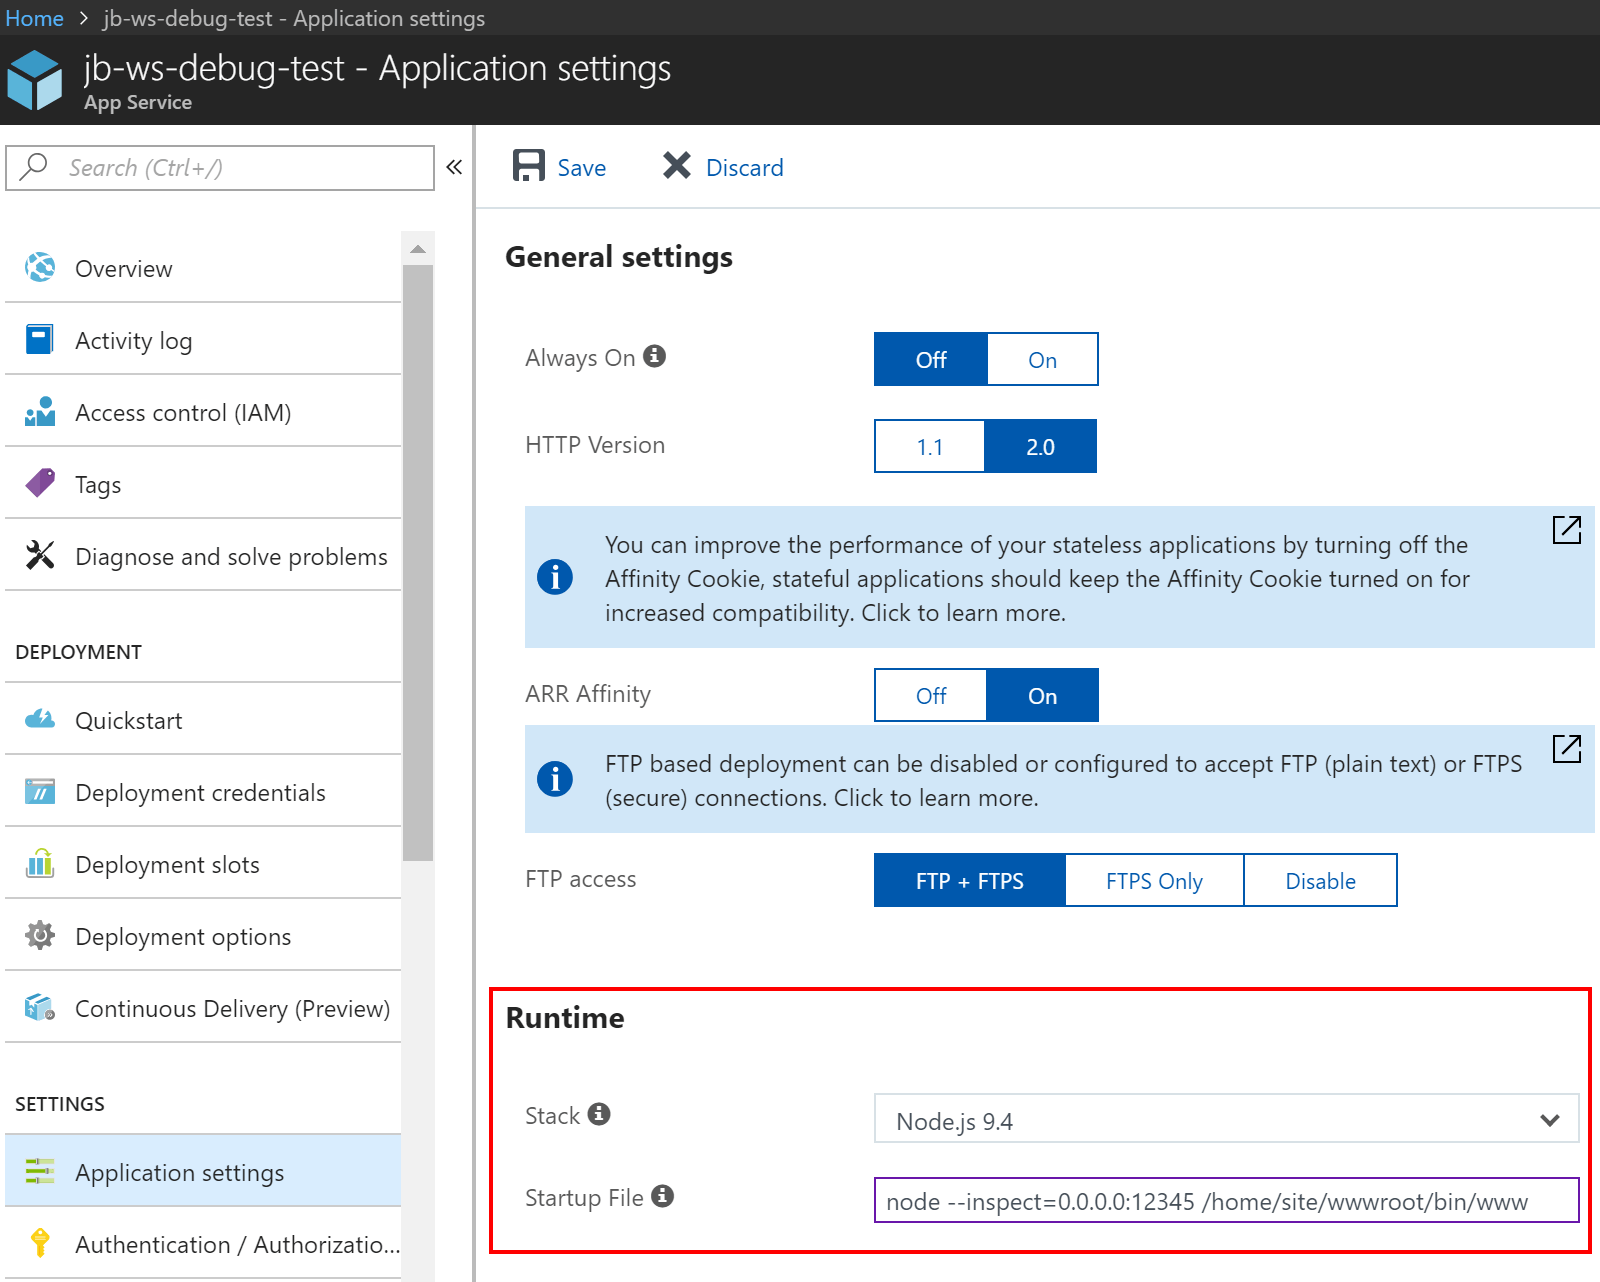
In the Azure portal, under our app’s Application settings, we can specify the startup file. I am using a boilerplate Express app for which the normal startup command is node ./bin/www. Adding the --inspect flag means my startup command in Azure will become:
node --inspect=0.0.0.0:12345 /home/site/wwwroot/bin/www
Or in the portal:
2. Setting up an SSH and debugger tunnel
The blog post about setting up an SSH tunnel with App Service on Linux explains this in much more detail, but in order to be able to attach to the Node.js debugger, we will need two things:
- An SSH connection to our App Service on Linux
- Port forwarding from our own PC to the environment in Azure
Let’s start with the SSH connection. Azure has no way to SSH into an App Service on Linux directly. Instead, the Azure CLI 2.0 has a command that sets up a private tunnel and exposes SSH. Make sure to check the prerequisites in this post, and then run this command:
az webapp remote-connection create -g RESOURCEGROUP_NAME_HERE -n WEBAPP_NAME_HERE -p 3008
The Azure CLI tool will create a tunnel between our PC and our App Service on Linux (specified by resource group and web app name), and expose it over port 3008:

Once done, we can SSH into our app service using that port 3008 and the credentials displayed on the command line, which is kinda cool (and also kinda irrelevant to this post, but still cool):
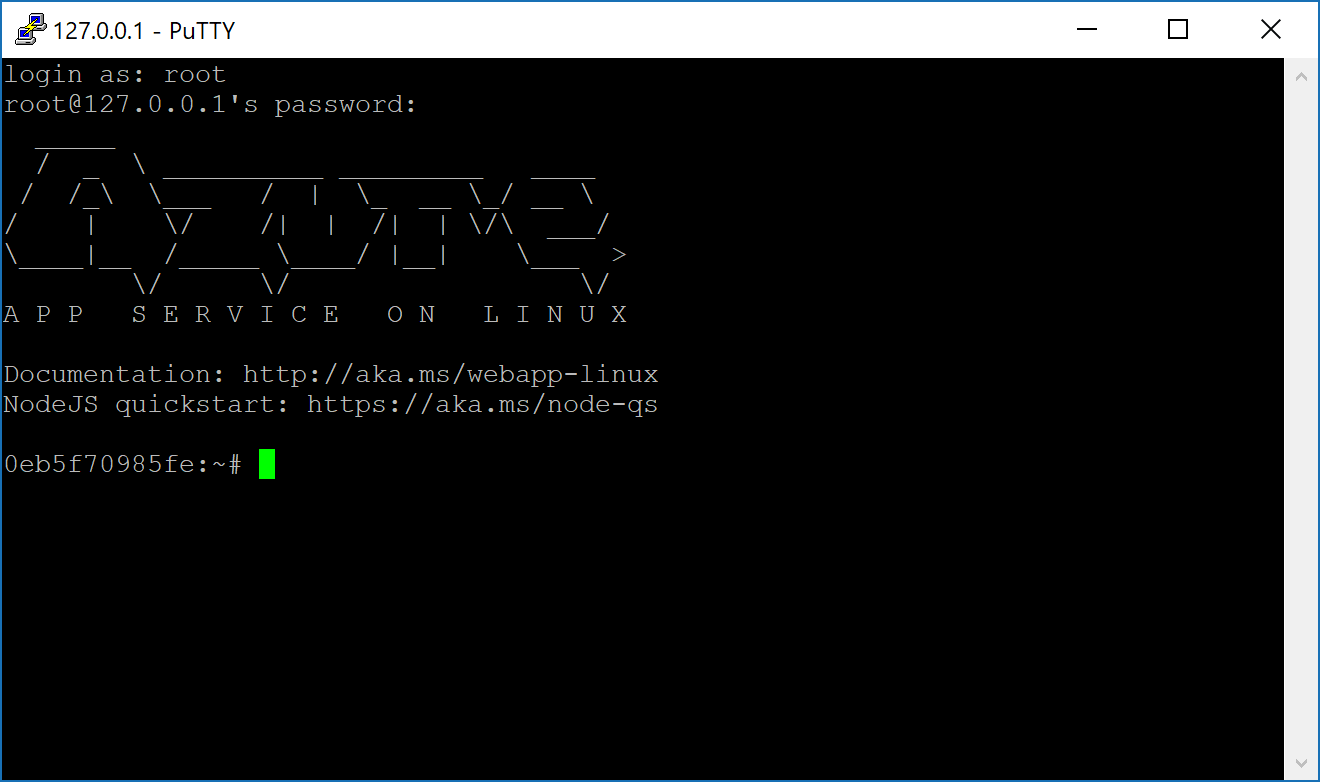
One thing left to do: in our first part, we told Node.js to listen on port 12345 (using the --inspect=0.0.0.0:12345 flag). So we will need to setup some port forwarding so WebStorm can connect to this debugger port that lives in a remote data center.
Setup port forwarding with an SSH client
Here’s a one-liner if you have an SSH client installed:
ssh -L 12345:127.0.01:12345 [email protected] -p 3008
(In more human language: forward local port 12345 to the SSH host listening on port 3008, binding to its local 127.0.01:12345 address and port.)
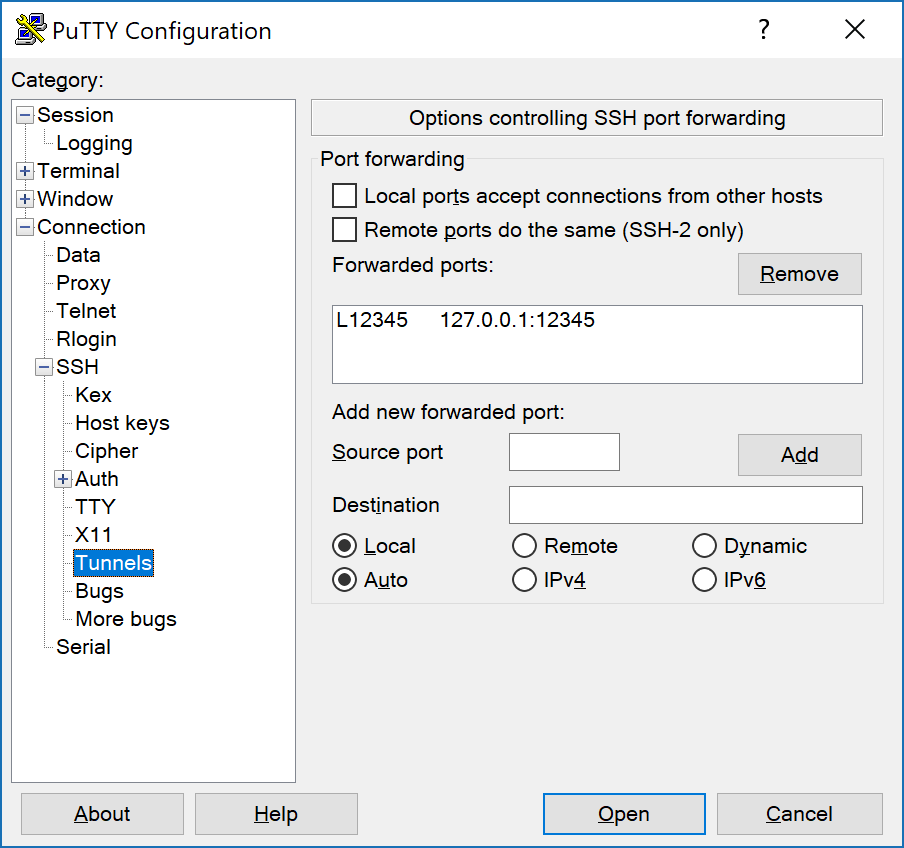
Setup port forwarding with Putty
We can connect to 127.0.0.01 port 3008. Under Connection | SSH | Tunnels, make sure to configure port forwarding first:
3. Setting up the WebStorm side
In WebStorm, we can create a new Run/Debug configuration of type Attach to Node.js/Chrome. Since we are port forwarding the remote debugger port over an SSH tunnel on our PC’s local port 12345, we can configure WebStorm as such:
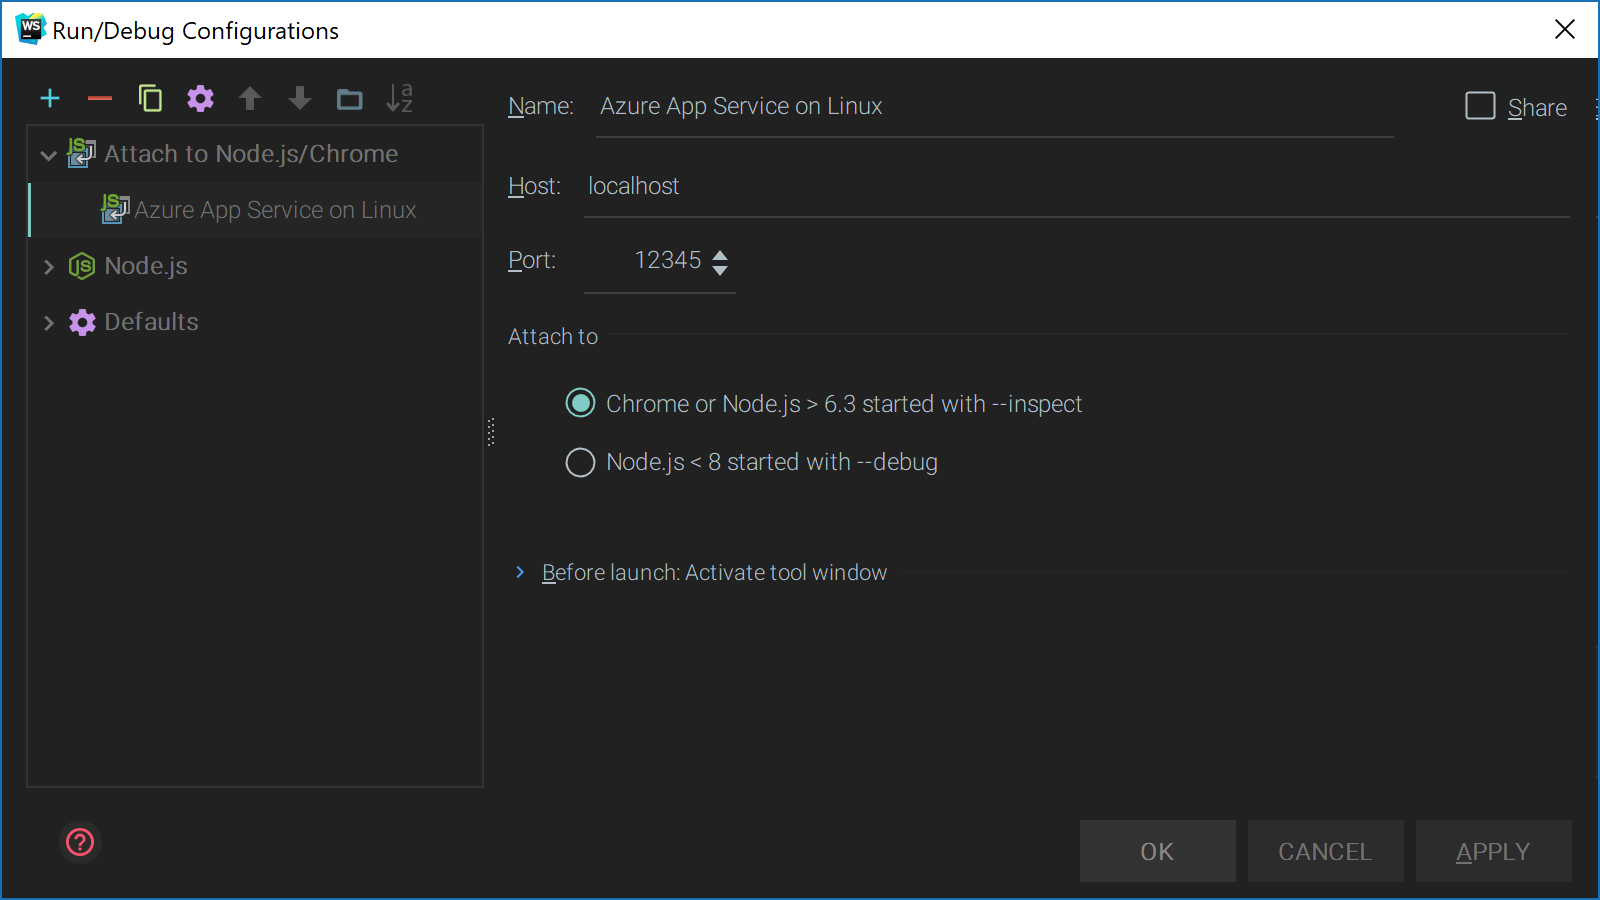
Once done, all that is left is to set a breakpoint and run this new configuration (Shift+F9). Once we it our Azure App Service in the browser, WebStorm will pause execution and lets us inspect variables, step through code, etc.
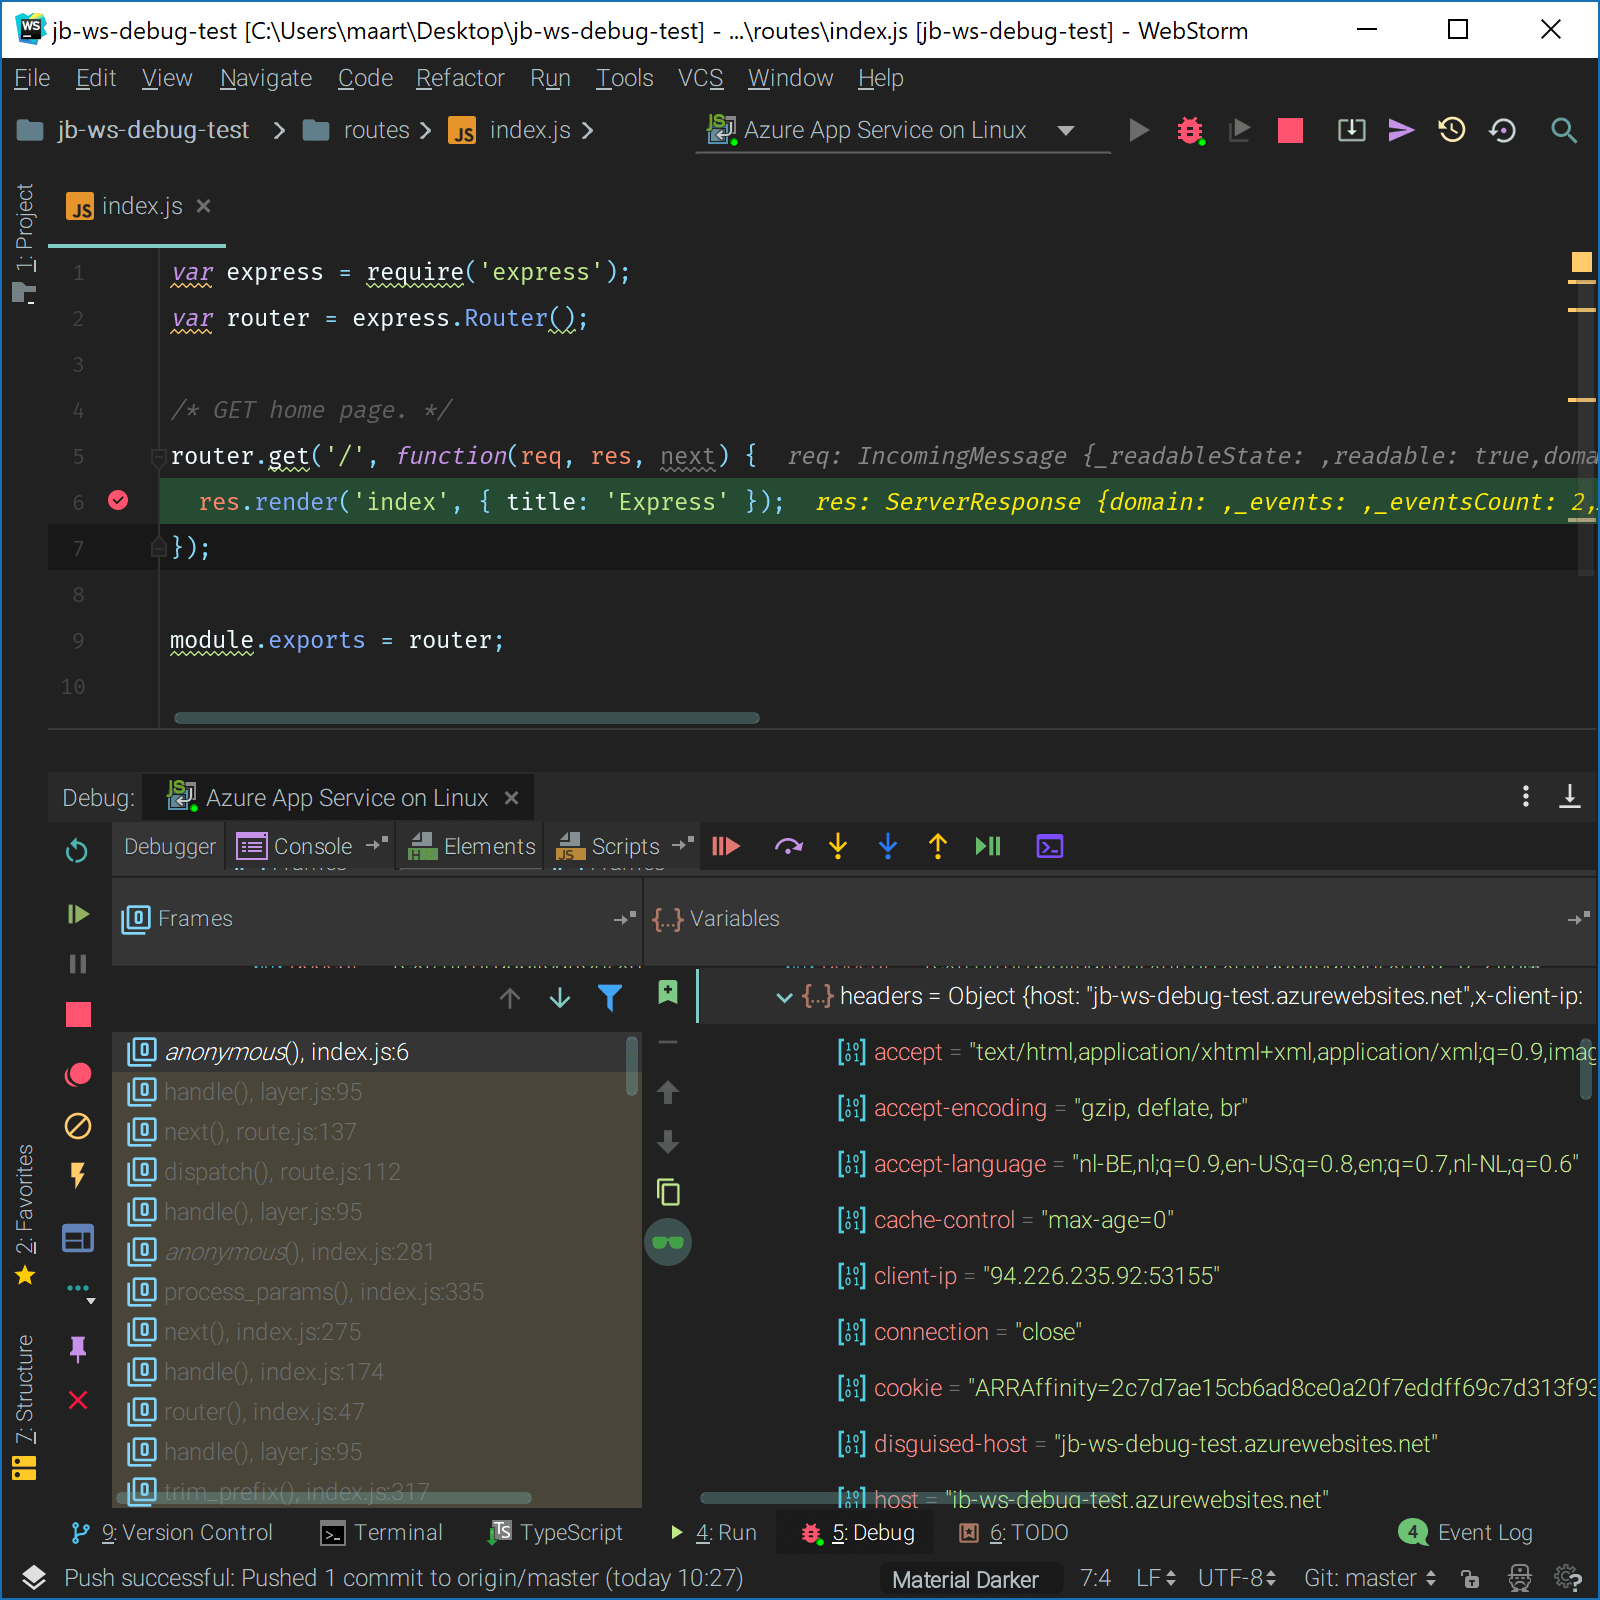
Summarized
Too long? Did not read? Here’s a gist of things to do:
- Install Azure CLI 2.0
- Add the latest webapp extension preview:
az extension add --name webapp - Set our web app start command in App Service on Linux:
node --inspect=0.0.0.0:12345 /home/site/wwwroot/bin/www - Run
az webapp remote-connection create -g RESOURCEGROUP_NAME_HERE -n WEBAPP_NAME_HERE -p 3008to setup an SSH tunnel - Run
ssh -L 12345:127.0.01:12345 [email protected] -p 3008(or port forward in Putty) to setup a debugger tunnel on top of the SSH tunnel - In WebStorm, create a new Attach to Node.js/Chrome run configuration that connects to
localhostport12345 - Start debugging
Enjoy!
PS: You want to know about that IDE theme? It’s the Material Theme UI.


One response