Exploring .NET managed heap with ClrMD
Edit on GitHubSince my posts on making code allocate less memory and memory allocation for strings were quite well received, I decided to add another post to the series: Exploring .NET managed heap with ClrMD. In this post, we’ll explore what is inside .NET’s managed heap (you know, the thing where we alocate our objects), how it’s structured and how we can do some cool tricks with it. We’ll even replicate dotMemory’s dominators/path to root feature.
So what is ClrMD? ClrMD is the short name for the Microsoft.Diagnostics.Runtime package which lets us inspect a crash dump or attach to a live process and perform all sorts of queries against the runtime. For example walking the heap (which we’ll do later), inspecting the finalizer queue, and more.
In this series:
- Making .NET code less allocatey - Allocations and the Garbage Collector
- Exploring .NET managed heap with ClrMD
- Exploring memory allocation and strings
Getting started
To get started with ClrMD, create a new Console Application and Install-Package Microsoft.Diagnostics.Runtime. Once we have that, we can start making use of ClrMD’s DataTarget class to work with either a dump file or by attaching to a running process.

Quick note: For this blog post, I created a sample project and published it to GitHub (ClrMD folder). In the ClrMd.Explorer project, I added a small helper method which launches a process and creates the DataTarget based on the process that was just launched.
Once we created the DataTarget, the entry point to the crash dump or live .NET process, we can start working with it. DataTarget has some info on which processor architecture is used by the dump or process and knows where to find symbols to provide additional information. It also provides access to the Common Language Runtime (CLR) version used, which gives us some additional information:
using (var dataTarget = DataTarget.AttachToProcess(demoProcess.Id, 10000, AttachFlag.Invasive))
{
	// Dump CLR info
	var clrVersion = dataTarget.ClrVersions.First();
	var dacInfo = clrVersion.DacInfo;

	Console.WriteLine("# CLR Info");
	Console.WriteLine("Version:   {0}",clrVersion.Version);
	Console.WriteLine("Filesize:  {0:X}", dacInfo.FileSize);
	Console.WriteLine("Timestamp: {0:X}", dacInfo.TimeStamp);
	Console.WriteLine("Dac file:  {0}", dacInfo.FileName);
}
If we run this against a process, we’ll get output similar to the following:
# CLR Info
Version:   v4.6.1586.00
Filesize:  6E1000
Timestamp: 575A139F
Dac file:  mscordacwks_X86_X86_4.6.1586.00.dll
The clrVersion variable (of type ClrInfo) holds information about the CLR used (for example its version), the DacInfo variable holds the “data access components” (hence DAC) for reading the data structures .NET uses internally to manage the heap, look at threads, … It is important to use the DAC that matches the CLR version and architecture of the process or crash dump we want to inspect - meaning if we have a crash dump from another machine we may have to acquire that machine’s DAC DLL in order to explore it with ClrMD. There is a bunch of documentation regarding the DAC on MSDN. We can see the DAC DLL which is used here by querying the DacInfo object.
Now that we have attached to our process and have access to the CLR and DAC, we can start exploring the runtime of the process we’ve attached to. Let’s see if we can get some information about the current AppDomain:
var runtime = clrVersion.CreateRuntime();
var appDomain = runtime.AppDomains.First();

Console.WriteLine("# Runtime Info");
Console.WriteLine("AppDomain:      {0}", appDomain.Name);
Console.WriteLine("Address:        {0}", appDomain.Address);
Console.WriteLine("Configuration:  {0}", appDomain.ConfigurationFile);
Console.WriteLine("Directory:      {0}", appDomain.ApplicationBase);
Looks like we can! The above snippet will output something like this:
# Runtime Info
AppDomain:      ClrMd.Target.exe
Address:        18576272
Configuration:  C:\Users\maart\Desktop\ClrMd\ClrMd.Target\bin\Debug\ClrMd.Target.exe.Config
Directory:      C:\Users\maart\Desktop\ClrMd\ClrMd.Target\bin\Debug\
The AppDomain gives us access to the modules loaded and lets us explore things like assembly and module metadata, some basic PDB metadata, … Things get more interesting when we look into the ClrRuntime. For example, we could enumerate the threads in our application and look at the stacktraces of whatever is running in there.
// Dump thread info
Console.WriteLine("## Threads");
Console.WriteLine("Thread count:   {0}", runtime.Threads.Count);
Console.WriteLine("");
foreach (var thread in runtime.Threads)
{
    Console.WriteLine("### Thread {0}", thread.OSThreadId);
    Console.WriteLine("Thread type: {0}",
							thread.IsBackground ? "Background"
					      : thread.IsGC ? "GC"
					      : "Foreground");
    Console.WriteLine("");
    Console.WriteLine("Stack trace:");
    foreach (var stackFrame in thread.EnumerateStackTrace())
    {
        Console.WriteLine("* {0}", stackFrame.DisplayString);
    }
}
Here’s the output:
## Threads
Thread count:   4

### Thread 692
Thread type: Foreground

Stack trace:
* InlinedCallFrame
* DomainNeutralILStubClass.IL_STUB_PInvoke(Microsoft.Win32.SafeHandles.SafeFileHandle, Byte*, Int32, Int32 ByRef, IntPtr)
* InlinedCallFrame
* System.IO.__ConsoleStream.ReadFileNative(Microsoft.Win32.SafeHandles.SafeFileHandle, Byte[], Int32, Int32, Boolean, Boolean, Int32 ByRef)
* System.IO.__ConsoleStream.Read(Byte[], Int32, Int32)
* System.IO.StreamReader.ReadBuffer()
* System.IO.StreamReader.ReadLine()
* System.IO.TextReader+SyncTextReader.ReadLine()
* System.Console.ReadLine()
* ClrMd.Target.Program.Main(System.String[])
* GCFrame

### Thread 2968
Thread type: Background

Stack trace:
* DebuggerU2MCatchHandlerFrame

### Thread 9748
Thread type: Background

Stack trace:

### Thread 3412
Thread type: Background

Stack trace:
Not very spectacular as an example, as the application we’re attached to is just a simple console application which occupies the foreground thread with waiting for input (System.Console.ReadLine()), but nevertheless quite cool to be able to access that information.
Now, I opened this post saying we’d explore the .NET memory heap, and so far we’ve only looked at how to attach to a process using ClrMD and print the stacktraces of all of our threads to the output. Let’s hold true to that promise - by first stepping back a little bit…
Structure of the managed heap
How would you write a managed type system and store it in memory? Store full objects with type information? Store values and type information separately? In another way? I often joke to people that programming is nothing more than mapping one data structure to another and then to another, with some logic in between. The CLR is not that different from this claim: it hold several tables of data and has some logic to map and combine them into what we as developers work with while writing code.
Quick note: The below information is based on structures displayed when working with the various debugger tools and ClrMD. I found .NET Type Internals - From a Microsoft CLR Perspective a good resource to validate some of my assumptions. There is some info in the ECMA-335 standard as well, but the CLR implementation does seem to be hard to find... If you find any mistakes or any documentation to back up these assumptions, please let me know in the comments below.
There is much more to the type system than what I will explain here, but it’s good to have this simplified model in mind when we’ll be working with the heap from ClrMD. I recommend reading .NET Type Internals - From a Microsoft CLR Perspective for more background.
When writing code, we always have the choice to work with Value Types (allocated on the stack) or Reference Types (allocated on the heap). Value types are quite simple in that they are a simple pointer to a few places in memory containing their embedded data. The CLR knows about the values stored and their size, so it knows the next field’s offset in memory.

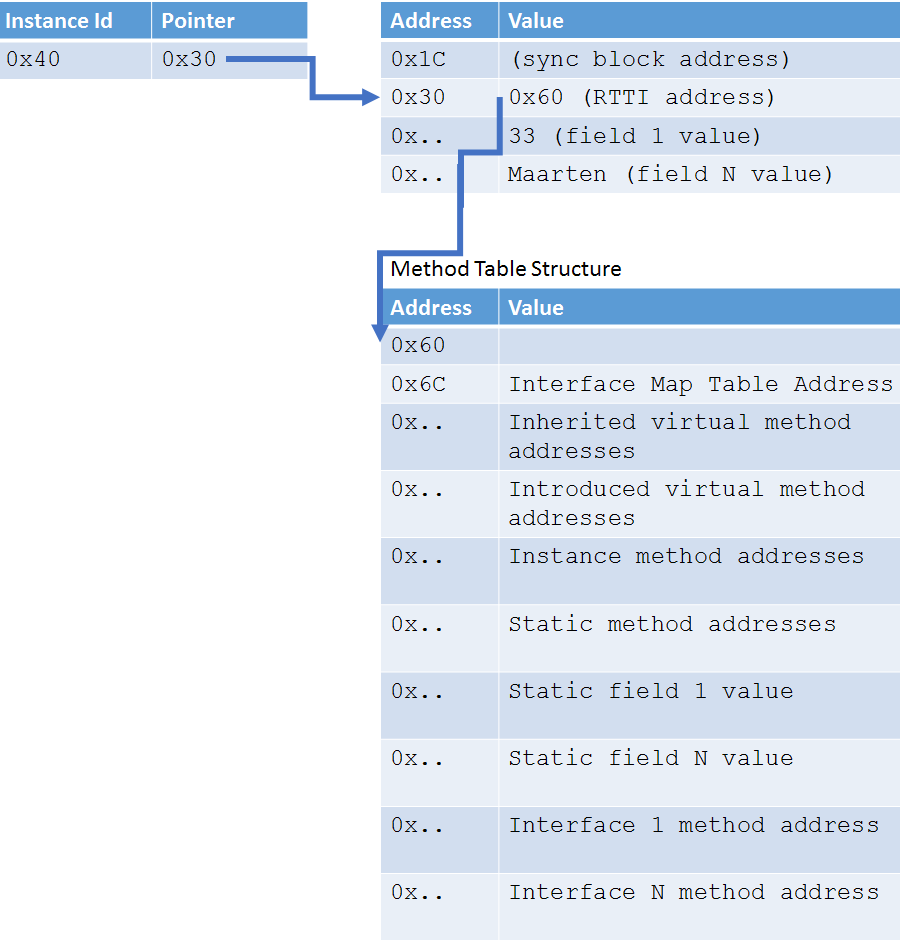
For reference types, things are slightly more complicated. They are allocated on the heap, which we’ll explore in a bit, and contain a bunch or references to metadata about the reference type, such as which interfaces are defined, where to find the methods that can be executed, …

Each instance of a Reference Type contains pointers to information the runtime can use to deal with Garbage Collection, Type information (RTTI - Runtime Type Information) and so on. Or in other words: a mapping of memory onto a table of information about the structure of our class, where its methods live, … We will see this in ClrMD as well: if we want to read an object, we’ll have to know about this and ask the CLR explicitly for type information.
Walking the heap with ClrMD
Enough theory, let’s get our hands dirty. We’ll go over two examples of walking the heap with ClrMD, the first one to see if the theory above is actually true.
Finding the top 5 string duplicates
As a starter, let’s fetch all strings present in the heap and get the top 5 of most duplicated strings (basically the same inspection dotMemory has).
First of all, we’ll have to ask the ClrRuntime for a reference to the heap. We can then check if it can be walked, and if so, start the fun.
var heap = runtime.GetHeap();
if (heap.CanWalkHeap)
{
	// ... walk the heap ...
}
Next, we can start enumerating object addresses (the left table in the last diagram above). For every object, we’ll get the runtime type information (by using the address in the left table to find the entry in the middle table to fetch the runtime type info from the bottom table). We’ll then check if the type is a string, and if so, use the metadata tables again to find the address to the actual string value and read that one.
var numberOfStrings = 0;
var uniqueStrings = new Dictionary<string, int>();

foreach (var ptr in heap.EnumerateObjectAddresses())
{
    var type = heap.GetObjectType(ptr);

    // Skip if not a string
    if (type == null || type.IsString == false)
    {
        continue;
    }

    // Count total
    numberOfStrings++;

    // Get value
    var text = (string)type.GetValue(ptr);

    if (uniqueStrings.ContainsKey(text))
    {
        uniqueStrings[text]++;
    }
    else
    {
        uniqueStrings[text] = 1;
    }
}

Console.WriteLine("## String info");
Console.WriteLine("String count:     {0}", numberOfStrings);
Console.WriteLine("");

Console.WriteLine("Most duplicated strings: (top 5)");
foreach (var keyValuePair in uniqueStrings.OrderByDescending(kvp => kvp.Value).Take(5))
{
    Console.WriteLine("* {0} usages: {1}", keyValuePair.Value, keyValuePair.Key);
}
The output:
## String info
String count:     586

Most duplicated strings (top 5):
* 16 usages: May
* 8 usages: Su
* 8 usages: Mo
* 8 usages: Tu
* 8 usages: We
Congratulations to ourselves, we just walked the heap! We enumerated object pointers, fetched runtime type information for them, and read their actual value from memory.
What object is keeping another object in memory?
For the next example, let’s write a quick demo application. Here is the full source code:
class Program
{
    static void Main(string[] args)
    {
        using (Clock clock = new Clock())
        {
            Timer timer = new Timer(clock.OnTick,
                null,
                TimeSpan.FromSeconds(1),
                TimeSpan.FromSeconds(1));
        }

        Console.WriteLine("Press <enter> to quit");
        Console.ReadLine();
    }
}

class Clock
    : IDisposable
{
    public void OnTick(object state)
    {
        Console.WriteLine(DateTime.UtcNow);
    }

    public void Dispose()
    {
    }
}
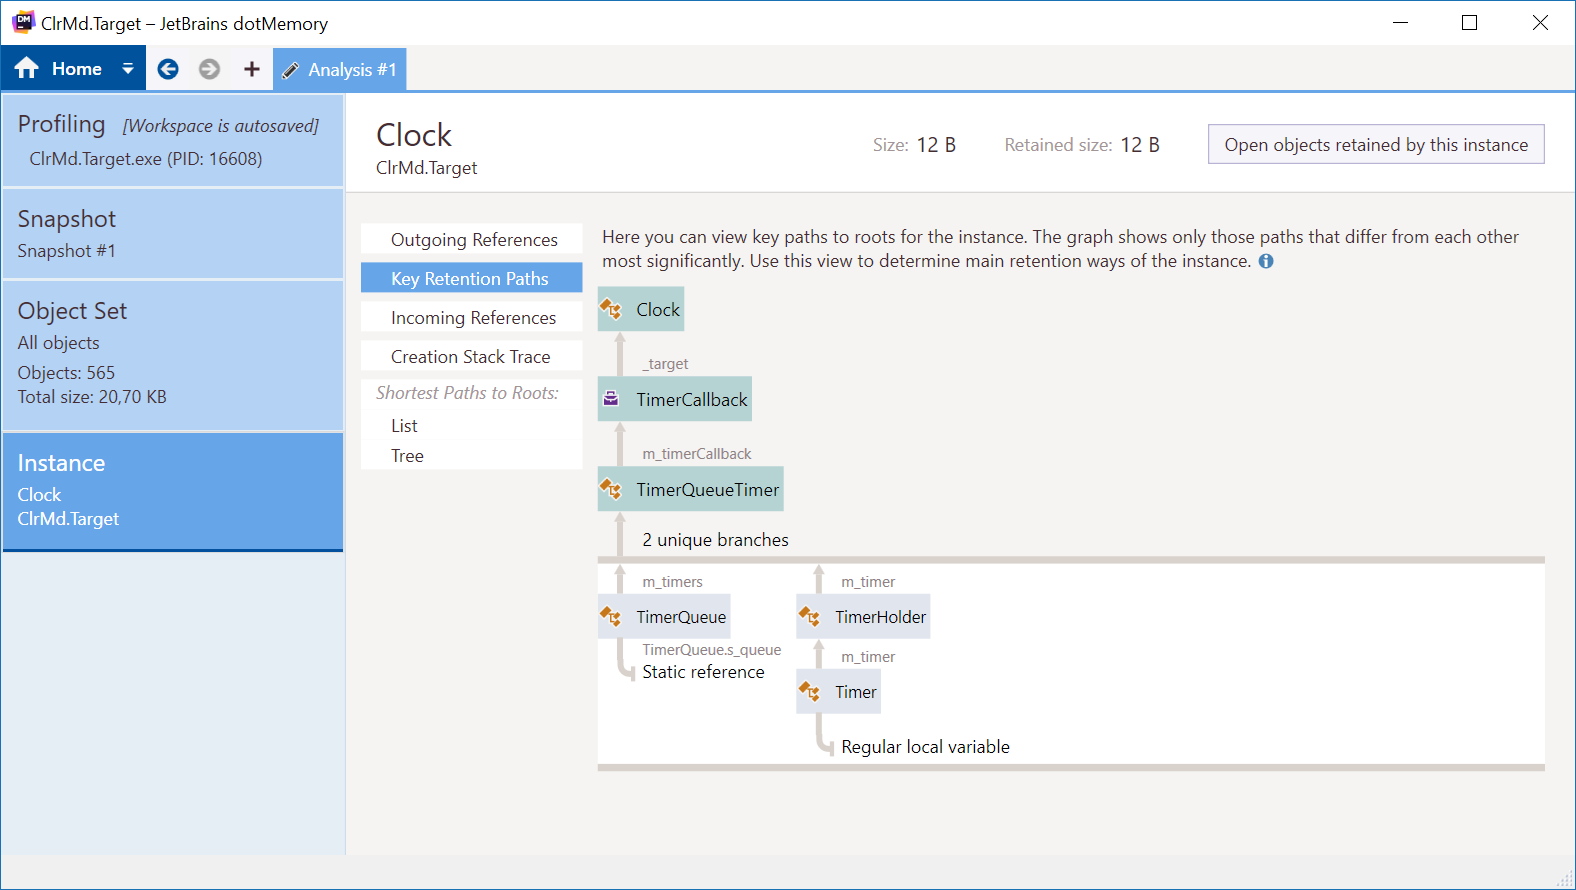
Even though we are disposing the Clock object, its OnTick method is still referenced from the Timer class’ Tick event, essentially preventing it from being garbage collected. In other words: this is a simple example of a potential memory leak, as our Clock will not be collected until we clean up that event handler. When using a profiler like JetBrains dotMemory, we’d be able to visualize the retention path of our Clock object. The profiler shows us the path from the GC root to our object, helping us in figuring out why it is in memory:

Quick note: What's this GC root you speak about, Maarten? Remember that the Garbage Collector (GC) checks if an object is still referenced or not and cleans up memory based on that information? The GC root is the highest level in our memory stack from which an object can be referenced. They, in turn, can reference other objects. Think of GC roots as the entry point into a tree of other referenced objects, where the GC root is a parent of all the objects in this tree if we'd walk it entirely.
Now let’s see if we can find out which object is keeping our Clock in memory using ClrMD! First of all, we’d need to acquire a reference to our heap again. Next, we’ll enumerate all object addresses in the heap and get type information for them. If the runtime type is our Clock, we’ll investigate the retention path.
// Dump heap info
var heap = runtime.GetHeap();


if (heap.CanWalkHeap)
{
	foreach (var ptr in heap.EnumerateObjectAddresses())
    {
        var type = heap.GetObjectType(ptr);
        if (type == null || type.Name != "ClrMd.Target.Clock")
        {
            continue;
        }


        // todo: retention path
    }
}
So far so good. Now what do we need to do to find out the retention path? Unfortunately, there is no way to walk “up” the tree, so all we can do is enumerate all GC roots and walk “down” the tree to find our Clock instance referenced by ptr:
// Enumerate roots and try to find the current object
var stack  = new Stack<ulong>();
foreach (var root in heap.EnumerateRoots())
{
    stack.Clear();
    stack.Push(root.Object);

    if (GetPathToObject(heap, ptr, stack, new HashSet<ulong>()))
    {
        // Print retention path
        var depth = 0;
        foreach (var address in stack)
        {
            var t = heap.GetObjectType(address);
            if (t == null)
            {
                continue;
            }

            Console.WriteLine("{0} {1} - {2} - {3} bytes", new string('+', depth++), address, t.Name, t.GetSize(address));
        }

        break;
    }
}
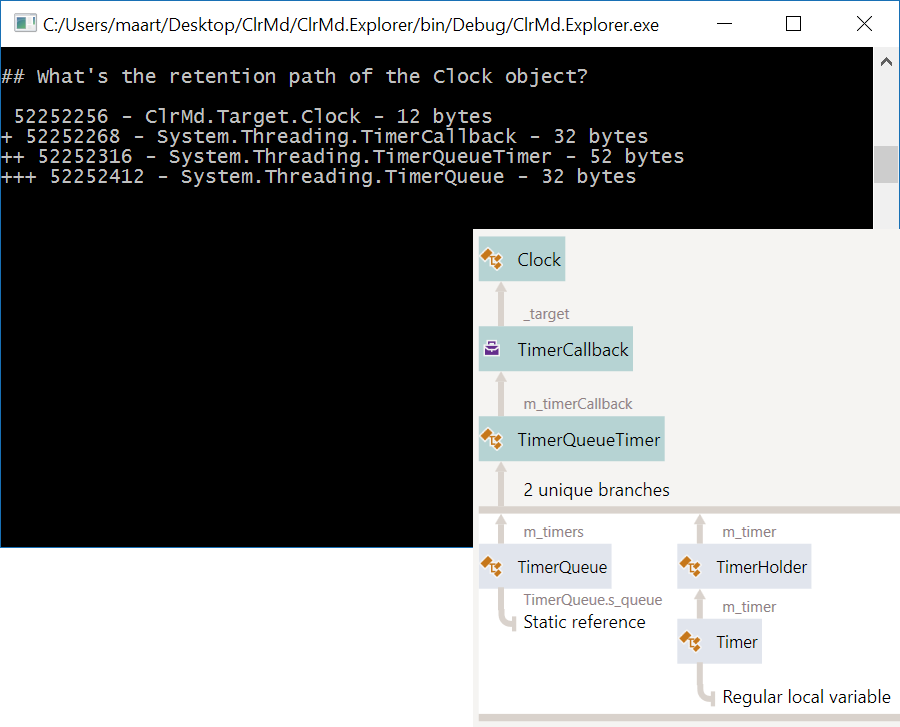
We’ll look into the real magic (GetPathToObject) in a bit, but just to explain what is happening here: for each GC root, we store the GC root’s object address in a stack, and then walk the entire tree below that GC root and push additional object addresses on that stack. If we do find our object in the tree based on the GC root, we simply walk each address in that stack and print the “path” to our Clock object.
Now onto the magic… GetPathToObject requires access to the CLR heap, needs the address of the object we are looking for (our Clock), the stack of objects we’ve found our object in, and a set of objects we’ve already investigated (so we don’t analyze the same tree of objects over and over again). I’ve added some comments in the code to explaining what it does.
private static bool GetPathToObject(ClrHeap heap, ulong objectPointer, Stack<ulong> stack, HashSet<ulong> touchedObjects)
{
    // Start of the journey - get address of the first objetc on our reference chain
    var currentObject = stack.Peek();

    // Have we checked this object before?
    if (!touchedObjects.Add(currentObject))
    {
        return false;
    }

    // Did we find our object? Then we have the path!
    if (currentObject == objectPointer)
    {
        return true;
    }


    // Enumerate internal references of the object
    var found = false;
    var type = heap.GetObjectType(currentObject);
    if (type != null)
    {
        type.EnumerateRefsOfObject(currentObject, (innerObject, fieldOffset) =>
        {
            if (innerObject == 0 || touchedObjects.Contains(innerObject))
            {
                return;
            }

			// Push the object onto our stack
            stack.Push(innerObject);
            if (GetPathToObject(heap, objectPointer, stack, touchedObjects))
            {
                found = true;
                return;
            }

			// If not found, pop the object from our stack as this is not the tree we're looking for
            stack.Pop();
        });
    }

    return found;
}
Et voila! If we now run this code, we’ll get the same information dotMemory provided us with earlier (added profiler’s diagram here as well):

Using a proper profiler is of course much easier, but one has to geek out every once in a while, no?
Conclusion
In this post, I wanted to take a practical approach to exploring the managed heap, and thought ClrMD was a good tool to use with that goal in mind. Do remember to explore the Internet for “ClrMD”, as there are tons of great samples out there (like Sasha Goldstein’s msos)! The ClrMD GitHub repo also has some fine examples.
Enjoy! And happy new year!


One response