Recently, someone asked me to look at their ASP.NET MVC application and help figure out why a certain request was taking 16 seconds to complete. It’s always fun to look at those things, so I could not pass on this nerd snipe.
Getting started: observe
Much like with hunting serial killers, you have to become one with the scene at hand. Watch the crime scene. Look at the things that happen, and observe.
Observation 1: response content with Fiddler
How can you observe a web application? The browser is a good start. Since this specific call was returning JSON data, I thought it easier to look at it in Fiddler instead. A typical response looked like this:
HTTP/1.1 200 OK
Transfer-Encoding: chunked
Content-Type: application/json
Server: Microsoft-IIS/10.0
Content-Security-Policy: frame-ancestors 'none'
X-Frame-Options: deny
X-XSS-Protection: 1; mode=block
X-Content-Type-Options: nosniff
Referrer-Policy: strict-origin-when-cross-origin
pubDatetime: Thu, 11 Jun 2018 07:14:05 GMT

...
When running this request and retrieving the response, response times were indeed between 12-16 seconds, for a call that in the end returned a few 100kb of JSON.
Looking at this response, a few things can be observed:
Transfer-Encoding: chunked- there is no content length specified, the server tells us it will send a bunch of chunks whenever it has data, and when the response is done it will tell us by closing the connection.Server: Microsoft-IIS/10.0- the server is a Windows machine, and has IIS 10.0 running to serve HTTP.
Observation 2: profiling with dotTrace
Since the code was readily available, it was easy to run this application locally and profile it. So I fired up my trusted friend dotTrace and used timeline profiling on the application.
A quick side note if you are unfamiliar with dotTrace: timeline profiling goes beyond traditional profiling in that it also captures Windows ETW events and allows correlating certain application activity with a certain HTTP call, inspect exceptions, and gives some insights in memory usage etc. as well. The ideal way of getting a first view of what an application is doing!
Here’s what the snapshot looked like when making that specific request a number of times:
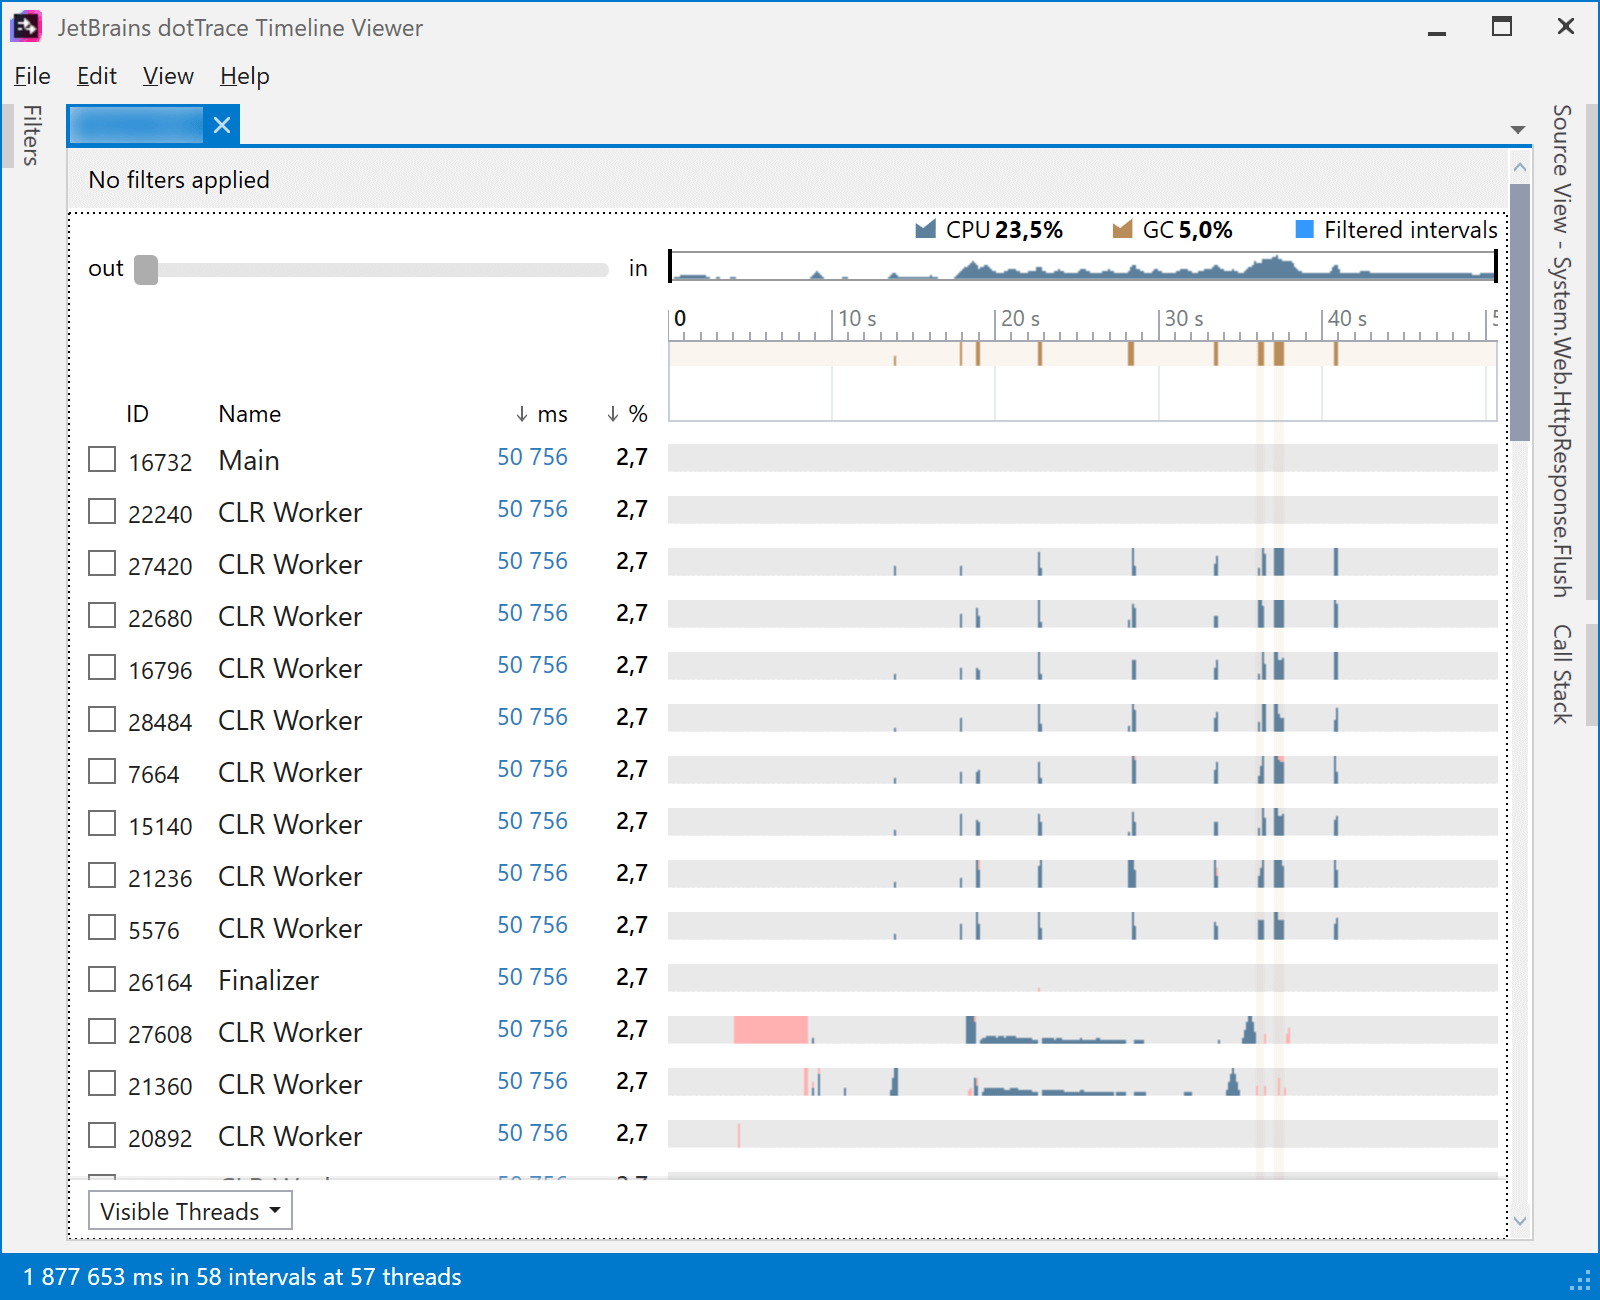
Whoa! A couple of things to observe!
- Spikes in Garbage Collection correlate with when executing our specific request.
- Lots of CPU usage in that specific request.
That already gives quite some information. Let’s look at the interesting period in the timeline, and then inspect the call stack.
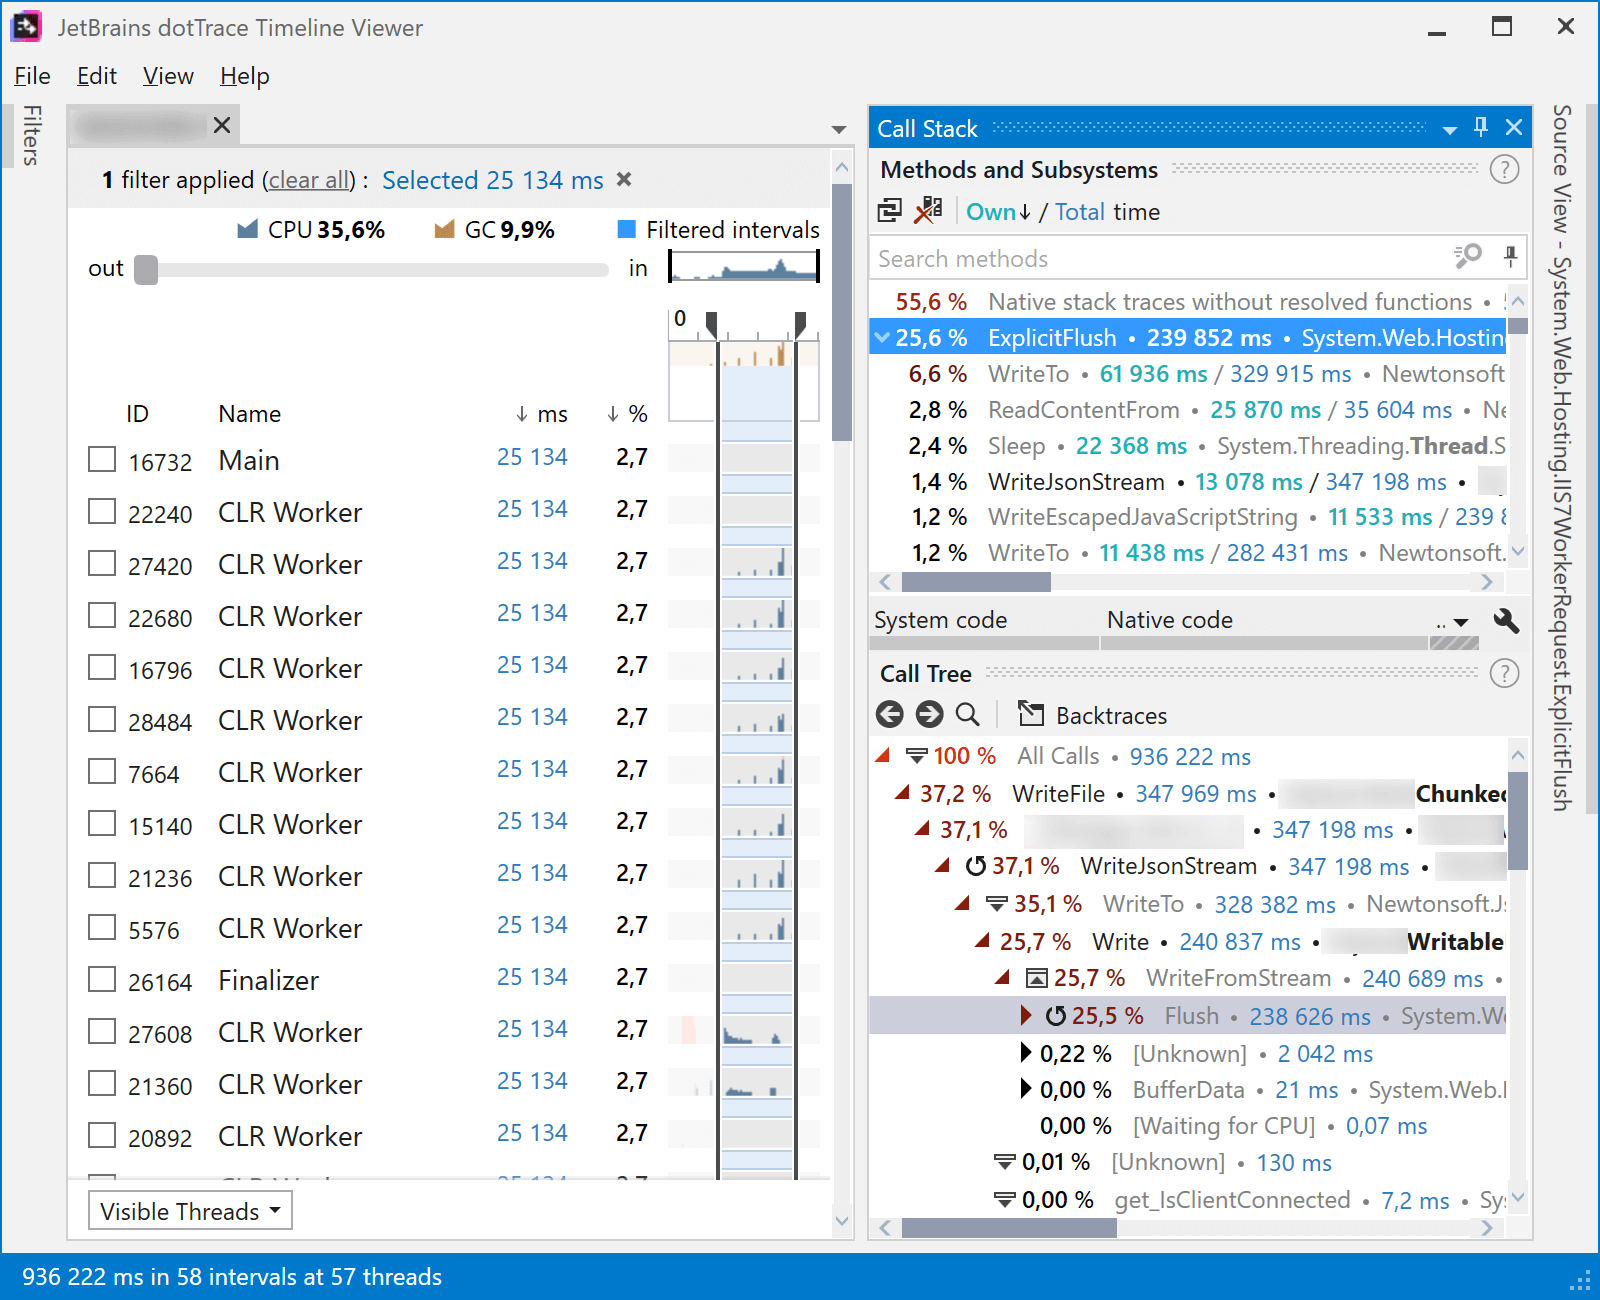
Even more whoa! What we can see here is:
- Some method named
ExplicitFlushis taking 25% of the time in this particular part of our snapshot. - If we look at the call tree below, this seems to be in a path where we are writing JSON to the output.
Interesting! The heavy hitter is the ExplicitFlush method, in the System.Web.Hosting.IIS7WorkerRequest class. Surely Microsoft would optimize their code, right?
Putting one and two together
The next thing to look at in this case would be the call tree we observed. Summarized, it looks like this:
- HTTP request comes in and hits the ASP.NET MVC Controller
- Controller does things and returns a
ChunkedFileStreamResultwhich, when executed, writes JSON to the output stream- Writing JSON to the output is done using JSON.NET, using the
JsonTextWriterclass- ASP.NET MVC and IIS do their thing to get the response to the client
- Writing JSON to the output is done using JSON.NET, using the
- Controller does things and returns a
How do we go from here… Let’s start at the top and see what happens in more detail!
Part 1: The Controller
The controller itself was not doing much work, just loading up a collection from the database and then returning JSON in a ChunkedFileStreamResult. Roughly this:
return new ChunkedFileStreamResult("application/json",
    outputStream =>
    {
        using (var streamWriter = new StreamWriter(outputStream, new UTF8Encoding(false)))
        {
            using (var writer = new JsonTextWriter(streamWriter))
            {
                writer.Formatting = Formatting.None;
                writer.WriteStartObject();

                foreach (...)
                {
                    writer.WritePropertyName("someproperty");
                    writer.WriteValue("somevalue");
                }

                writer.WriteEndObject();
            }
        }
});
Nothing too special, right? Just some JSON being streamed.
Part 2: The ChunkedFileStreamResult class
The ChunkedFileStreamResult class looked like a class that was created to be able to return a Transfer-Encoding: chunked result to the client. Some basic info on chunked transfer encoding is available on Wikipedia. The general idea behind using this is that neither the sender, neither the receiver have any idea of the stream being sent, nor whether it will be sent at once or in bits and pieces when data becomes available.
When would you use this? Typically in any of these scenarios:
- When you have no idea of the data you will be sending. Typical scenarios here are streaming binary data, where you want to just send over bits and bytes of the data as it comes available.
- When you want to keep the connection open and send data when needed (often used in “real-time” frameworks, keeping the connection open and sending and processing data when needed).
- Some more, but these are the most common I have seen.
In this application, it could make sense to indeed use chunked encoding. The size of the JSON being sent is unknown upfront, and who knows, if it becomes 500 MB it would be a nice advantage not to have to buffer that in memory, and just send it out in bits and pieces.
Enough theory, let us look at the code:
public sealed class ChunkedFileStreamResult
    : FileResult
{
    private readonly Action<Stream> _streamAction;

    public ChunkedFileStreamResult(string contentType, Action<Stream> streamAction)
        : base(contentType)
    {
        _streamAction = streamAction ?? throw new ArgumentNullException(nameof(streamAction));
    }

    protected override void WriteFile(HttpResponseBase response)
    {
        response.BufferOutput = false;

        response.FlushSafe();

        using (var stream = new WritableHttpResponseStreamWrapper(response, response.OutputStream))
        {
            _streamAction(stream);
        }
    }
}
Nothing fancy, this is pretty much how we can enable chunked encoding in any ASP.NET application:
- Set
response.BufferOutput = falseso that data is not buffered and instead sent to the client immediately. - Write to the
response.OutputStream
Part 3: writing JSON to the output stream
In the above code snippet, some work happens executing the _streamAction. And we have seen that work in Part 1 - we are writing JSON to the output stream, essentially. What could possibly go wrong here?
Part 4: being confused about PInvoke
Looking at all the code snippets, things seemed quite okay. Yet the profiler shows differently. And reality, too - the request takes too much time to execute!
So let’s circle back to our observations and look into the ExplicitFlush method, in the System.Web.Hosting.IIS7WorkerRequest. Good thing is that the source code is available!
What ExplicitFlush does under the hood is call into native code using PInvoke, flushing data to IIS.
Wait. PInvoke??? That’s okay to use, but if it gets called many many many times, PInvoke may be the source of the performance penalty we are seeing. As per the docs:
PInvoke has an overhead of between 10 and 30 x86 instructions per call. In addition to this fixed cost, marshaling creates additional overhead. There is no marshaling cost between blittable types that have the same representation in managed and unmanaged code. For example, there is no cost to translate between int and Int32.
For better performance, have fewer PInvoke calls that marshal as much data as possible, instead of more calls that marshal less data per call.
Let’s repeat that last one: For better performance, have fewer PInvoke calls that marshal as much data as possible, instead of more calls that marshal less data per call.
So… could it be that we are making too many PInvoke calls under the hood that don’t marshal much data at once? Is this the performance hit we are experiencing?
Part 5: The Controller, JSON.NET, StreamWriter and ChunkedFileStreamResult
Let’s see if we can figure out why ExplicitFlush is being called so many times… Flushing data to a stream happens when writing to a stream, so let’s open our controller again and then use ReSharper’s navigate to decompiled code (or similar) and step deeper into an example call:
using (var streamWriter = new StreamWriter(outputStream, new UTF8Encoding(false)))
{
    using (var writer = new JsonTextWriter(streamWriter))
    {
        // ...

        writer.WriteStartObject();

        // ...
    }
}
Navigating into WriteStartObject gives us a call that delegates a write action to an internal writer:
// ...

this._writer.Write('{');

// ...
That inner writer is the StreamWriter class, as can be seen from the using statements in code. Navigating deeper gives us:
// ...

this.Flush(true, false);

// ...
We are on to something! Preliminary conclusion is that for every single call to Write... in JSON.NET, we are calling an underlying Flush (which in the end hits our dreaded ExplicitFlush).
And for sure: every single JSON token we are writing is triggering a flush. Making a PInvoke call under the hood, because that’s what we told ASP.NET to do by setting response.BufferOutput = false; in the ChunkedFileStreamResult class.
GOTCHA! But now, the fix…
Fixing things
There are in fact two fixes to this. A first one is setting AutoFlush = false on our StreamWriter. This will not invoke the underlying ExplicitFlush on every write, and would solve things for sure.
We decided to go with another approach, though. As we mentioned earlier in this post, ChunkedFileStreamResult could be useful if we do not know the size of the data we will be sending. We don’t know, but we do know that the typical JSON returned will not be too large (a few 100kb maximum), so there is no need to use chunked encoding anyway.
So in our controller instead of using this special stream result, we can simply return our JSON by rendering it into a string and returning that instead. Rough pseudo-code:
return new StringContent(
    JsonConvert.SerializeObject(data), null, "application/json");
Under the hood, this fix would not set response.BufferOutput = false;, which means ASP.NET will buffer data for us before making the PInvoke call into IIS to send data back to the client.
Running the code base after this fix yielded 450ms on that specific request, instead of 12-16 seconds.